LAMUM Best Practices: Best Historical Usage Reports

There are many reports available in LAMUM. This guide will walk you through them. We recommend determining with your management about which reports are most useful.

Current Checkout Reports
  • Realtime data
  • Who has licenses checked out, and for how long
  • Catch hoarders and those with multiple licenses
  • New :8182 ‘Restricted View’ (9.3)
Historical Usage Reports
  • Patterns of checkouts and Usage over time
  • List of Users in a given time period
  • How close to capacity are you running?
  • Usage Trends over extended periods
  • Chargeback/Allocation reports
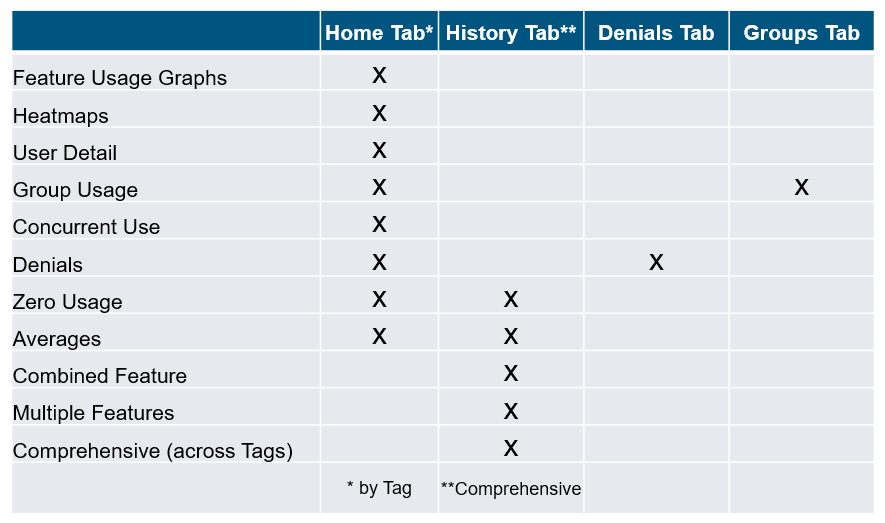
Types of Historical Usage reports in LAMUM
** Reports that take longer than 15 seconds should be setup as Batch reports

Delivery Options
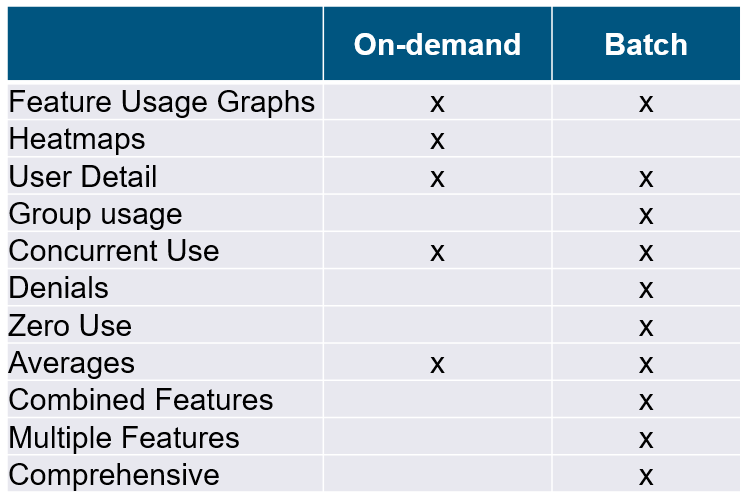
Feature Usage Graphs
  • By Tag > Feature,
  • Any time period
  • Dynamic, turn off unneeded graph elements
  • Save as .jpg image
  • Multiple Features Graph
  • Same Tag, multiple features plotted in same graph (up to 6 features)
  • Also available as a Multiple Features Table
  • Multi-view Graph Set
  • Up to 8 graphs from same Tag
  • Batch only
Heatmaps
  • Visualize Checkout behavior 24×7
  • Predict day / time when Denials may occur
  • Visualize Denial occurrence 24×7
  • Useful for:
  • Engineers
  • Multiple time zone licenses (WAN-Global)
  • Only for short periods (< 1 month)
  • Save as .jpg
User Detail reports
  • By Tag > Feature
  • Understand who your Users are for given Feature, in a given time period
  • User Details: review all Tools (features) used by a selected engineer, in a given time period (Performance Appraisal?)
  • Individual usage ‘%’ for given Tool, Time
  • Export to Excel
  • Chargeback by User
Group Usage
  • Table of Usage by Groups
  • Graph of Usage by Group/Feature
  • By Tag > Feature
  • Group Details: review all Tools (features) used by all engineers in a selected Group, in a given time period
  • Group usage ‘%’ for given Tool, Time
  • Export to Excel
  • Chargeback by Group
Creating Groups
  • Interactive method
  • Off-line method (Excel import)
  • Active Directory method
  • With auto-sync (9.3.1)
Concurrent Use Graphs
  • By Tag > Feature
  • 24×7 (if WAN Global Users)
  • M-F 8-5 (if LAN Users, same time zone)
  • How many Floating Licenses do you need?
  • % of time at each actual level of
  • Concurrent use
  • Maximum number of concurrent checkouts
  • Determine “Probability of a Denial”
  • Save as .jpg

Important to review before “Renewal”

Denials
  • FlexLM
  • Flex Debug Log, by Tag
  • Need unobstructed access
  • May need to set up a rotation cron
  • Debug Log must be read/write
  • Set up Flex Denial Parser
  • DSLS
Denial Reports
  • Denials Overview (across all Tags)
  • Filter on Denial Code
  • Denials by Tag > Feature
  • Heatmap Graph
  • Denials History Graph
  • Denial Details for all Users, for given Tag> Feature, and time period
  • Denial Details for specific User

~5% Denial probability is acceptable

Zero-use reports
  • By Tag
  • Comprehensive (across all Tags)
  • What features have not been checked out
  • Look for features that cost extra money!
  • Do engineers need training?
  • Copy to Engineering Manager
  • Export to Excel

Great monthly or quarterly Batch report

Multiple Graph Set
  • 9.3
  • Batch only
  • Up to 8 Graphs per set, per Tag
  • Usage Graph
  • Top 10 by Count and by Duration
  • Heatmaps: Checkouts and Denials
  • Concurrent-use: 24×7 and M-F 8-5
  • Users Overview
Features by Tag
  • Batch report only
  • Selected Features by Tag – Graphs
  • Selected Features by Tag – Tables
Averages
  • All used Features, by Tag
  • Comprehensive (across all Tags)
  • Total Usage Time, in given period
  • Average Checkout Time
  • Useful for setting up “Long Checkout Alert”
  • Average number of concurrent Users
  • Number times at Max

7-day On-demand, or Batch for longer periods

Combined Feature Reports
  • Only if same Tool is offered on multiple License Servers
  • Combined Feature Graph
  • With Feature use Total line
  • Combined Feature Table
  • Colors can altered

On-demand or Batch for Graph report, Batch for Table report

Multiple Feature Reports
  • Up 6 Features, same Tag, plotted together in a graph, for given time period
  • With Feature use Total line
  • Correlation of use?
  • Colors can be altered
  • Up 6 Features, same Tag, with all User
  • Details in a Table, for given time period
Delivery methods
  • Interactive
  • On-demand (Favorites; User Dashboards)
  • Batch (Email; Folders) (must be set up in advance)
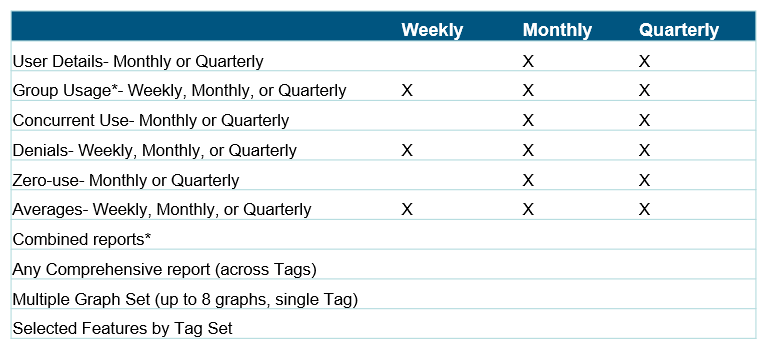
Reports that take longer than 15 seconds should be setup as Batch reports.
Batch

Meet with management and show all the reports available. Choose the report. Choose a time period. Choose delivery method. Create a list. Each Manager will be different!

  • Weekly (last 7 days, arrives Monday)
  • Monthly (last 30 days, arrives 1st day of calendar month)
  • Quarterly (last 90 days, arrives 1st day of calendar quarter)
  • Yearly (last 365 days, arrives 1st day of year)

Software License Optimization – Don’t Forget Your Engineers!

Are you working on a software optimization project – perhaps Microsoft optimization? Don’t forget your engineering teams as part of this project.

When looking at which software and license to consolidate, make sure you have the data you need for license reconciliation. LAMUM can help you be a trusted advisor and bring knowledge to your organization. Make sure to learn more and check out our Reports.

Our usage and asset monitoring reports can help you with your annual planning for budgets across the organization. Historically, LAMUM helps companies monitor many license types such as FlexLM amongst others. LAMUM is also very helpful in knowing which software assets to consolidate.

LAMUM can also help you with trend analysis and potential forecasting for your future needs.

Avoid over-subscribing on your licenses!

Impact of Inaccurate Data on Engineering Software License Management

eWEEK DATA POINTS recently reported about the SaaS sprawl, but the same concept applies to engineering license management. Managers need accurate data to:

  • Understand company engineering software license usage
  • Effectively adjust and renew licenses
  • Forecast future usage patterns. 

The article also addressed:

  • Impact of too many licenses on overall organization.
  • Inaccurate, reactive and outdated information to make important decisions.
  • Avoid relying on vendor notifications.
  • Managers need centralized information to make better decisions.

Engineering License Monitoring for Tekla (by Trimble)

Whether you work for an oil & gas or AEC company, your team is most likely using Tekla by Trimble. But how are your engineers using it? Would you like to see usage reports and make sure your team is getting the most of the tool.

Make sure your structural and construction-oriented engineering team is using the tools the most.

There are a number of applications of Tekla:

  • Steel Fabricators – Detailing, fabrication and erection of steel structures
  • Concrete – Model, plan and pour concrete
  • Precast Producers – Optimize the precast workflow (bidding to delivery)
  • Bridge Engineers – Comprehensive BrIM solution for bridges and other civil structures
  • Rebar – Manage detailing, prefabrication and placing of all rebar
  • Offshore – manage your project effectively – this is especially when LAMUM can be helpful with seeing how the team around the world is using expensive tools

There are also a number of different products that are part of Tekla – for any structure, and any location or time zone:

  • Tekla Model Sharing
  • Tekla PowerFab – Complete and connected steel fabrication management software suite.
  • Tekla Structural Designer – Analyze and design buildings efficiently and profitably.
  • Tekla Structures – BIM software for accurate, constructable modeling.
  • Tekla Tedds – Powerful software to automate your repetitive structural calculations.
  • Trimble Connect – A tool that connects the right people to the right constructible data.

You can learn more about how we support Tekla by Trimble here. Contact us today to optimize your engineering license management better for tools such as Tekla and many others.

Ready for License Negotiations? Make Sure You Have the Data You Need

At TeamEDA we assist global companies with license usage analysis for Engineering Software (CAD, EDA, Simulation, Math, etc.) and assist them in identifying costs savings, on average 20% of their annual license spend.

We are proud to have helped many companies choose LAMUM (License Asset Management and Usage Monitoring) software to track user ratios and global location usage of their engineering software products, in preparation for license negotiations. The data and insights gained from LAMUM are instrumental in companies having access to critical data for future conversations and decision making.

Talk to a TeamEDA representative today or launch a complimentary 30-Day trial, to see how your business can improve license efficiencies, save on administration time and make cost savings with LAMUM. 

Book a Demo 

LAMUM tracks and manages network floating licenses for a large number of software providers and license daemons (FlexLM, Reprise, Sentinel RMS, HASP, LM-X, etc.).  Please get in touch for a short demo to learn more about our solution and the amazing ROI our customers have experienced.

Digital Twins & Managing Complex Engineering Software Licenses

Companies are continuing to invest rapidly in new Digital Design, Simulation, Management and Service lifecycle software toolsets to achieve a Digital Twin that suits their needs. Many of these run on FlexLM (or similar) license mechanisms, hence we would like to show you how License Asset Manager with Usage Monitoring can be a great asset to your team and company. 

What does a “digital twin” mean?

Schnitger Corporation recently explained this topic in a great article. “Easy: a digital version of a physical thing.”

As the article addresses, connecting various sources of data can be a challenge. Now, consider all the various engineering licenses the team may be using. Do you have a full comprehensive understanding of how the team uses these engineering licenses?

Do you currently have any plans or opinions for Digital Twin’s? We would be interested in hearing your thoughts.

Are You Ready for an Increase in Engineering Software Audits?

Are you seeing more requests for software audits? Due to the COVID-19 pandemic, companies are rightsizing and focusing on gaining control of their engineering software environment to remain compliant.

Software vendors are faced with renewals with lower license counts and addressing revenue streams that focus on license compliance. It might seem like the enterprise IT software providers are simply looking to update their software. In reality, they might be installing an agent that measures true utilization rates.

You are not alone. Computer Weekly has reported on the increase of software audits.

  • 1/5 of IT asset managers claim a significant increase in audit requests
  • 27% have noticed a slight increase.
  • On average, a software audit takes 60 working days to complete.

It’s clear that many of the Tier 2 and Tier 3 Engineering Software vendors are active in software audits at the moment. So be prepared for audits from any direction. Make sure you recoup your costs.

With many organizations experiencing changes in staffing, are you prepared to address a software audit if needed?

This is where TeamEDA comes in with LAMUM to make life easier to manage engineering software licenses and track utilization for compliance now and budgeting for growth after COVID-19 for add-on licenses of engineering new hires.

LAMUM (License Asset Manage with Usage Monitoring) makes software audits much easier. With LAM side of the product, you can see all of the engineering licenses. With UM, you can then see usage monitoring.

Applying System-Engineering Approach to Your Engineering Software

We have discussed the complexity of product development in our blog before – of how much various software is involved and how different teams use it differently. For example, a recent article in Electronic Design looks at the example of launch vehicle (and the various subsystems).

A system-engineering approach helps streamline, achieve more efficiency, greater quality, and overall timeliness. This is where TeamEDA can come in. We can help you gain a better oversight of your engineering software. You can see better how your team is using expensive engineering software. Traditionally system-engineering includes:

  • Well-defined steps
  • Requirements analysis
  • Strategies to meet the iterative requirements
  • Design
  • Verification and validation.

The engineering needs:

  • Understanding the overall requirements
  • Identifying different subsystems and components
  • Broader specifications

In the example of the launch vehicle, consider:

  • Propulsion
  • Vehicle structures
  • Aerodynamics
  • Flight mechanics
  • Navigation, guidance and control (NGC) systems
  • Avionics
  • Stage auxiliary systems
  • Thermal systems
  • And much more.

Is your team familiar with all the software the various departments are using (CAD, CAX, EDA, PLM, Simulation, Analysis and many others)? Would you like to see better reports and alerts? Talk to our experts today to gain better transparency.

Zemax Recommends Using TeamEDA to Monitor & Manage License Usage of Their Products

TeamEDA (License asset and monitoring platform for Engineering tools) and Zemax LLC have collaborated over the last couple of months to integrate Zemax OpticStudio, LensMechanix, OpticsBuilder and OpticsViewer licenses into the LAMUM monitoring engine.

“Customers may wish to monitor and report on how Zemax licenses are being utilized in their network, including maximum number of licenses used at any given time.”

Read More on MyZemax.

Do you have Zemax license you would like to monitor? Let us know.

Confirmed with Zemax

LAMUM has been tested and is confirmed to work correctly with Zemax products.

Learn More

LAMUM from TeamEDA is now recommended by Zemax to monitor and manage license usage of Zemax products providing detailed usage information and insights.

To start your free 30 Day trial and understand the value LAMUM can provide to your team, please contact TeamEDA here.

Being Proactive vs. Reactive in Engineering License Management

Address Key Engineering Software Asset Management Pain Points

There have been some conversations in the news this week about key pain points in engineering Software Asset Management (SAM). What are the biggest challenges your organization has? (See article in CIO Applications).

The benefits of an effective engineering SAM system include

  • Clear license position.
  • Being audit-ready – Are you prepared for external software audits?
  • Avoiding penalties for non-compliance
  • Optimizing software procurement & expenses
Complexity of Engineering Software Environment
  • How complex is your organization’s engineering software?
  • Is new software being added / deployed?
  • Are there engineering assets that the team no longer uses?
  • Are you aware of the license changes when software versions are updated?
  • Are you clearly keeping track of compliance and utilization levels?
Being Proactive vs. Reactive
  • Know your license position ahead of time.
  • Minimize risk of penalties.
  • Avoid having excess or too few software licenses.
Simplify Engineering Asset Management
  • Identify installed software products.
  • Match installed engineering software products to existing software licenses:
    • Current licenses available.
    • Demand planning.
    • Reduce software purchasing costs.
  • Produce reports and dashboard views.